The objective of this assignment was to produce a data-driven narrative using information visualisation intended for public audience. I aim to share the results of my findings from the exploration of a data set on the sales of video games over the years.
An Overview on Video Games
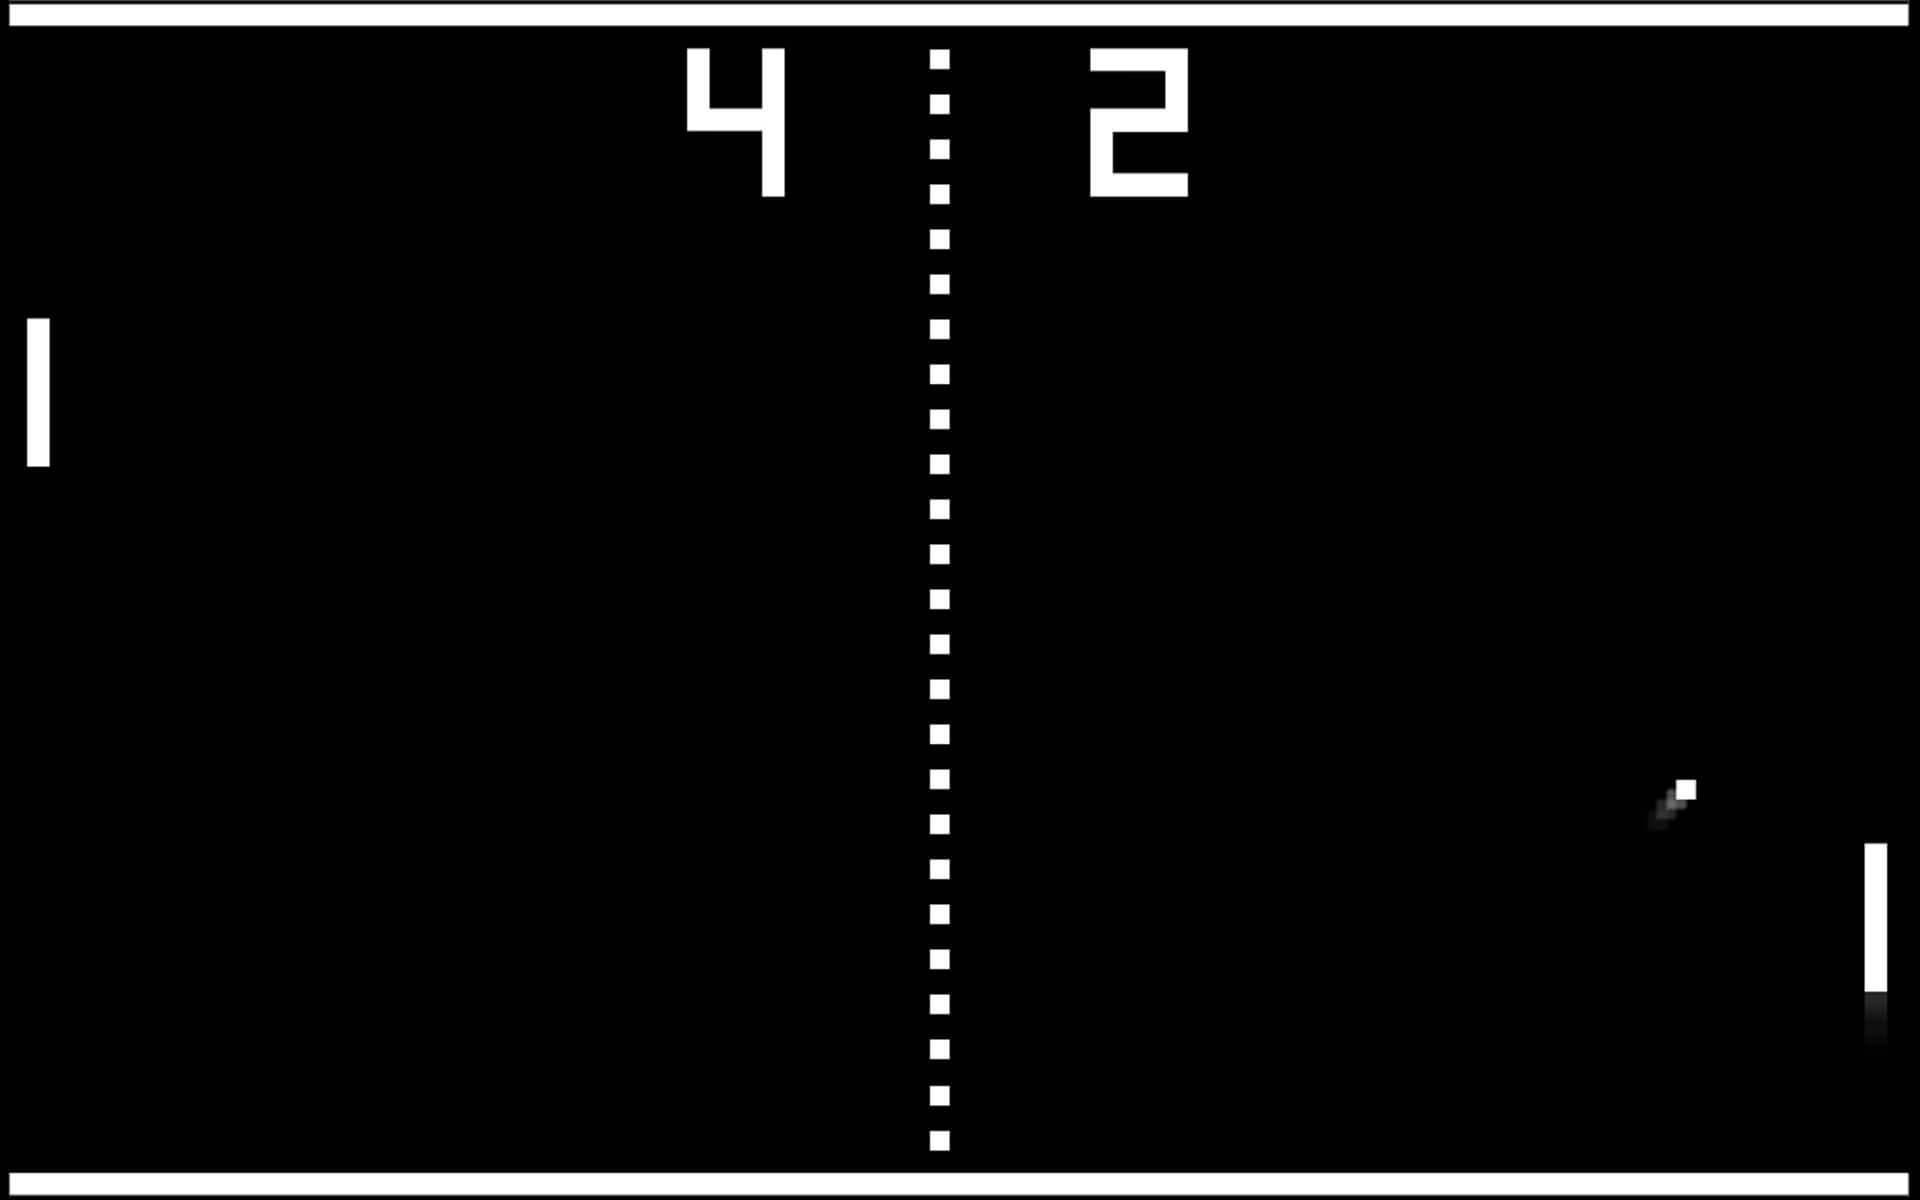


In today’s world, it’s difficult to remember a time when computer games and consoles were not commonplace. Since we are constantly exposed to large amounts of material, we seem to take these inventions for granted and forget what it was like before them. When computer scientists started to idealize games and simulations on mainframe computers in the 1950s and 1960s, the development of video games began. Since then, it has developed exponentially as an industry, expected to generate an estimated $179.7 billion in 2021. (Marketwatch.com)
Is there a Secret to a Successful Video Game?
I’ll be analysing a data collection* hosted on kaggle.com in order to investigate the likelihood of a “perfect formula” for a successful video game these days. You will find this data collection in question here if you want to investigate it further.
Due to the scale of the dataset (over 16,000 records) and the limitations of my technologies (we have suffered some fatal crashes with this data set…), I’ll be concentrating on the top 500 values in the dataset.
*The script to scrape the data is available at https://github.com/GregorUT/vgchartzScrape.
It is based on BeautifulSoup using Python.
There are 16,598 records. 2 records were dropped due to incomplete information.
Some key things to look at in the dataset:
- Publisher – Publisher of the game
- Global_Sales – Total worldwide sales.
- Name – The games name
- Platform – Platform of the games release (i.e. PC,PS4, etc.)
- Year – Year of the game’s release
- Genre – Genre of the game
Choose Your Fighter (Super Smash Bros. reference)

Who Takes The Crown?
A total of 51 publishers are represented in our data collection of 500 entries. These publishers are shown by their logos in the image above. You’ll instantly recognize some of them, while others will have you scratching your head, trying to remember whether they’re familiar or not.
How Does This Translate to Consoles?
To understand the demographic of gamers I think it’s important to take our hierarchy chart and visualize it in terms of the platform that the game was released on. Most games nowadays are cross-platform but for the sake of this visualization I have gone with the most popular console for each game.
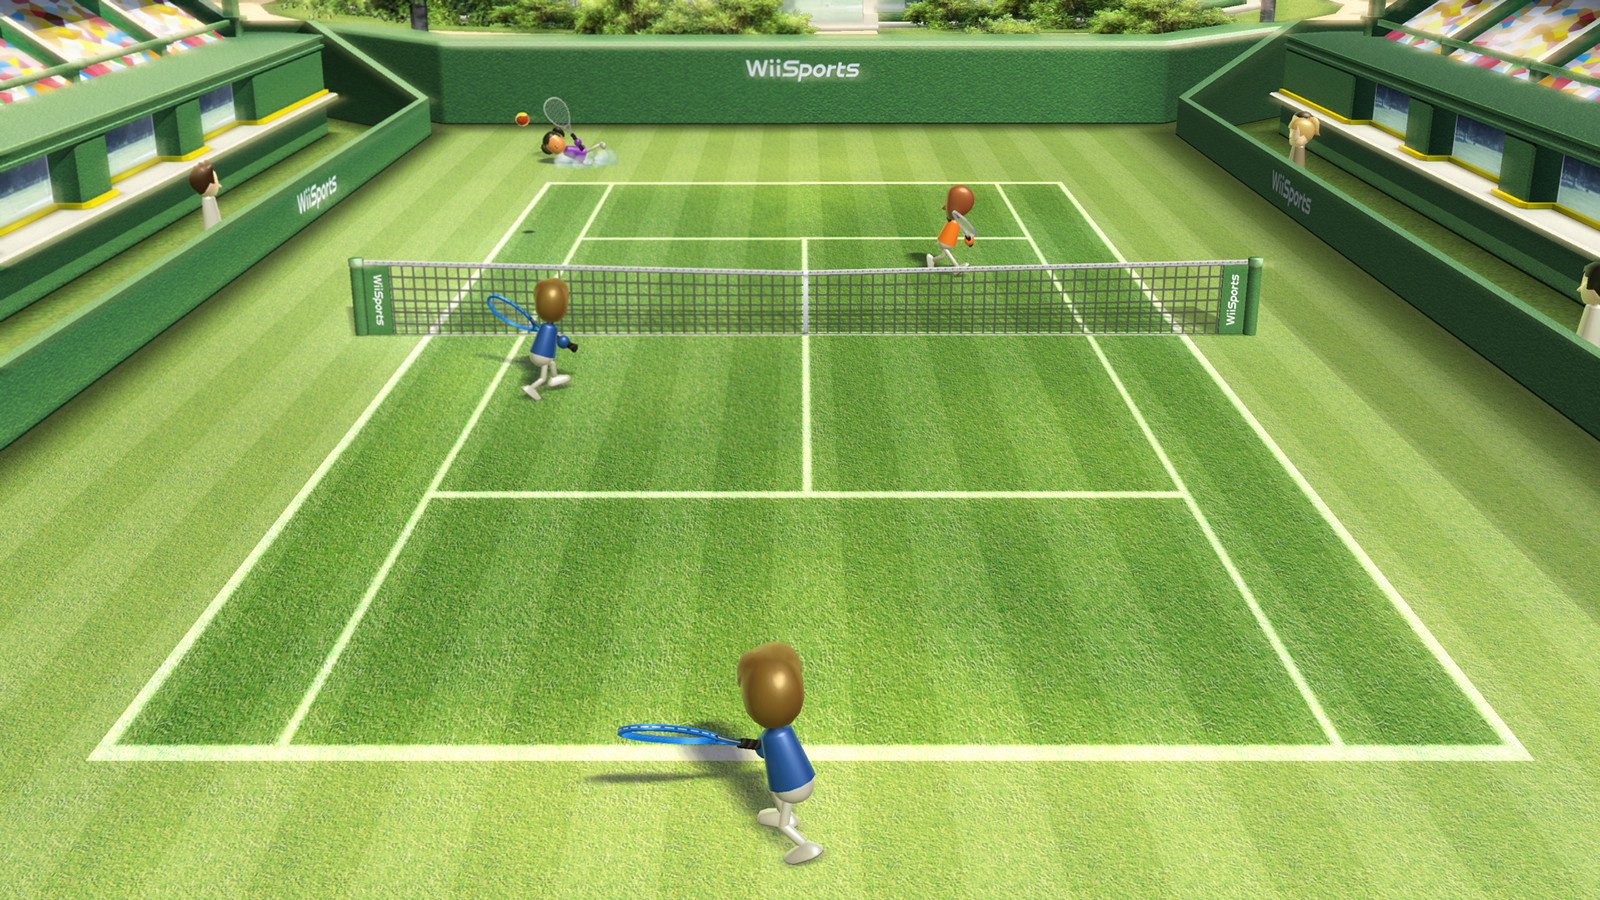
When you compare the two, you’ll see that Nintendo is the obvious winner in terms of sales. This is much more intriguing when you consider that the Wii was the most popular console for playing games during the set. Nintendo owns the Wii console, in case you didn’t remember. Some publishers, such as Activision and Electronic Arts, do not own consoles and instead just produce games that can be played on existing consoles. This has had a strong impact on their earnings, which have fallen well short of Nintendo’s.

I learned from the results that publishers who own their own consoles are more likely to sell a lot more than those that don’t. This makes sense because they have built their consoles and gaming machines to only work on their own titles. With the likes of Xbox and Play Station, we’re well aware of this.
This is the first factor that I noticed in the dataset to help me understand if there is a secret to a successful game launch. That is that gaming giants like Nintendo and PlayStation do considerably better than the likes of Ubisoft or Atari.
How Have Genre’s Developed Over Time?
The other trend that I discovered in the dataset that helped me to understand why companies like Nintendo dominate the gaming world with the introduction of sports themed games. We all remember Wii Sports when it was launched, most houses in the country ended up with the console for Christmas. This was because Nintendo broke the market with family orientated and active games. This made parents and adults of households more likely to agree to the console being bought.
Just take a look at these advertisements from the Nintendo Wii in 2008. You will notice the marketing aimed towards families and being active.
In Conclusion
In conclusion there are definitely more aspects of video games sales to be explored with this data set. But even just scratching the surface has reveled how well our shopping habits and lifestyles can be capitalized on by tech giants in the gaming industry and beyond.
If you want to learn more about the history of video games, of which I could never do justice, take a look at this Ted-Ed talk by Safwat Saleem.
